


If you switched from Universal Analytics to GA4 and suddenly could not find bounce rate, you were not alone. Thousands of marketers panicked. Some thought it was gone. It was not. GA4 just pushed it to the back seat and gave a better metric the front row.
That metric is engagement rate. Once you understand how the two work together, you will read your analytics in a completely different way.
What Changed When GA4 Replaced Universal Analytics
Universal Analytics defined a bounce as anyone who landed on a page and left without clicking anything else. That sounds logical until you think about it more carefully. Someone could spend 8 minutes reading a 2,000-word article, absorb every word, and UA would still label them a bouncer. That is a terrible way to measure whether your content is working.
GA4 fixed this by flipping the framework. Instead of tracking what did not happen, it tracks what did. Bounce rate did not disappear. It just became the leftover after engagement rate is calculated. The two are now mathematically linked, which makes the whole system cleaner.
What Is Engagement Rate in GA4
Engagement rate is the percentage of sessions where a user did something meaningful on your site. A session counts as engaged if any one of these conditions is met:
- The user stayed for more than 10 seconds
- They triggered a conversion event
- They viewed 2 or more pages or screens
Formula: Engagement Rate = (Engaged Sessions / Total Sessions) x 100
So if 700 out of 1,000 sessions were engaged, your engagement rate is 70%. That is a clean, positive signal. It tells you more than ‘did they click elsewhere’ ever could.
What Is Bounce Rate in GA4
Bounce rate in GA4 is literally the inverse. It measures the percentage of sessions that were NOT engaged. The user landed, stayed under 10 seconds, viewed only one page, and triggered no conversion.
Formula: Bounce Rate = (Unengaged Sessions / Total Sessions) x 100
Here is the relationship that makes GA4 elegant:
Engagement Rate + Bounce Rate = 100%. Always.
If your engagement rate is 72%, your bounce rate is 28%. No ambiguity. This was not the case in Universal Analytics, where the definitions could overlap depending on how you set up events. GA4 keeps it simple.
Engagement Rate vs Bounce Rate in GA4: Side-by-Side
Here is how the two stack up across every dimension that matters:
| Feature | Engagement Rate | Bounce Rate |
| What it measures | Percentage of engaged sessions | Percentage of unengaged sessions |
| Formula | Engaged Sessions / Total x 100 | Unengaged Sessions / Total x 100 |
| Session qualifies when | 10s+ OR conversion OR 2+ pages | Under 10s, no conversion, 1 page only |
| Primary or secondary | Primary metric | Secondary metric |
| In default GA4 reports | Yes, available by default | No, must be added manually |
| Best for measuring | Content quality and traffic value | Quick-exit diagnosis and paid traffic |
| Good benchmark | 60% to 70%+ is healthy | 25% to 40% is generally healthy |
| UA equivalent | Did not exist in UA | Similar name, different definition in UA |
What Are Good Numbers for Each Metric
There is no universal number that works across every industry. But these are solid starting benchmarks:
Engagement Rate Benchmarks
- 60% to 70%: Good target for most sites
- Above 70%: Strong performance
- Below 50%: Needs attention, investigate by page and traffic source
Bounce Rate Benchmarks
- 25% to 40%: Healthy for most site types
- 40% to 55%: Average, especially for blogs
- Above 65%: A warning sign worth investigating
One important context point: blog pages and informational content naturally have higher bounce rates because people find what they need and leave. That is not always a problem. A 70% bounce rate on a recipe page is very different from a 70% bounce rate on a pricing page.
If you want to understand what is really driving your numbers, a thorough SEO audit can surface exactly which pages are dragging your metrics down and why.
How to Find Both Metrics in GA4
Engagement rate shows up by default in several GA4 reports. The quickest route is: Reports > Acquisition > Traffic Acquisition.
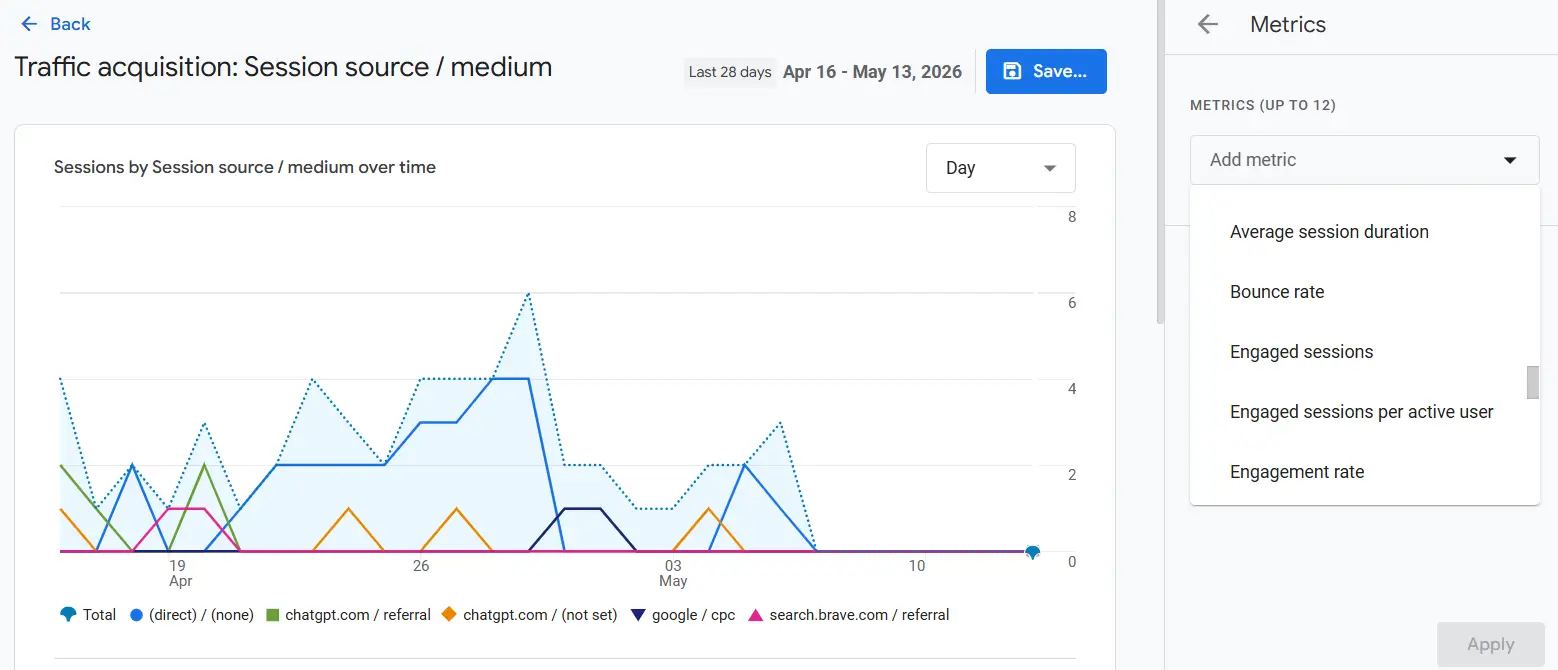
Bounce rate is a bit more buried. Here is how to add it:
- Open the Traffic Acquisition report in GA4
- Click the pencil icon (Customize report) in the top right corner
- Click Metrics in the right-hand panel
- Search for Bounce rate and click the + button to add it
- Click Apply. It stays in that report until you remove it
You can also compare both metrics across different traffic sources in the same view, which makes it easy to spot if a specific channel is bringing low-quality visitors.
Which Metric Should You Actually Focus On
For most marketers and website owners, engagement rate is the better primary metric. It tells you something is working, not just that something failed to happen.
Bounce rate earns its place when you are running paid traffic. If someone clicks an ad, lands on your page, and leaves in 4 seconds, you want to know that immediately. It could mean slow page speed, misleading ad copy, or a gap between what the user expected and what they found.
A lot of bounce rate problems trace back to on-page SEO issues: poor page structure, content that does not match search intent, or headers that mislead visitors about what the page actually contains.
For the technical side of things, your technical SEO setup plays a big role too. Slow load times, render-blocking scripts, and broken mobile experiences all push bounce rate up before the visitor has even read a word.
What Causes a High Bounce Rate in GA4
These are the most common culprits, in rough order of frequency:
Slow Page Speed
If your page takes more than 3 seconds to load, a large portion of visitors will leave before seeing any content. This is a technical problem before it is a content problem.
Content and Intent Mismatch
Someone searches ‘GA4 bounce rate formula’ and lands on a page about analytics in general. They are gone in under 5 seconds. The content exists, but it is wrong for that query.
Poor Mobile Experience
Most traffic today is on mobile. A page that breaks on smaller screens or forces horizontal scrolling will spike your bounce rate fast, regardless of content quality.
Thin or Misleading Content
If the page does not give visitors a clear reason to stay or explore further, they will not. This includes vague introductions, walls of text with no structure, and pages that over-promise in their title.
Our guide on how to reduce bounce rate walks through the practical fixes for each of these issues with specific steps you can apply today.
If you are wondering whether a high bounce rate is hurting your Google rankings directly, we cover that in our post on bounce rate and rankings, including what Google has actually said about it.
Engagement Rate and Off-Page Factors
Here is something most guides skip: where your traffic comes from affects how people behave once they land.
Organic traffic from Google generally shows higher engagement than traffic from social ads or display campaigns. Searchers arrive with a specific intent, so they are more likely to read and click. If your site ranks for the wrong keywords, you may pull in visitors who were never interested in what you offer, and your engagement rate will reflect that.
This is where off-page SEO connects to your analytics metrics. The signals pointing to your site influence who finds you and on what terms. Getting both metrics healthy often means looking at the full picture, not just the page itself.
If you want a structured approach to diagnosing and improving this across your whole site, working with an SEO consulting expert can help you build a strategy that connects traffic quality to on-site behavior.
Quick Note: Bounce Rate vs Pogo Sticking
These two get confused constantly. Bounce rate in GA4 tells you whether a session was engaged or not. Pogo sticking is a different behavior: when someone clicks a Google result, immediately returns to the search results, and clicks on a different result. That is a user signal, not a GA4 metric.
For the full breakdown of what separates them and why it matters for your organic performance, read our post on bounce rate vs pogo sticking.
FAQs
What is the difference between engagement rate and bounce rate?
Engagement rate measures engaged sessions, while bounce rate measures sessions that were not engaged. In GA4, the two metrics always total 100%.
Did GA4 completely remove bounce rate?
No. Bounce rate still exists in GA4, but Google now prioritizes engagement rate because it gives a clearer picture of user behavior. You can still track bounce rate manually inside GA4 reports whenever you need it.
What is a good engagement rate in GA4?
A healthy engagement rate for most websites is between 60% and 70%. If your number is below 50%, it usually signals weak content, poor targeting, slow pages, or traffic that does not match user intent.
Is a high bounce rate always bad for SEO?
Not necessarily. Informational pages often have higher bounce rates because visitors get their answer quickly and leave. A high bounce rate only becomes a concern when users leave important pages without taking action or engaging further.
Why is my GA4 bounce rate suddenly different from Universal Analytics?
GA4 measures bounce rate differently than Universal Analytics. Instead of tracking simple exits, GA4 calculates bounce rate based on unengaged sessions, making the data more accurate and useful for modern websites.
Can slow website speed increase bounce rate?
Yes. Visitors often leave if a page takes longer than a few seconds to load. Slow speed, broken mobile layouts, and poor user experience can raise bounce rate even before users read your content.
Should I focus on engagement rate or bounce rate in GA4?
Focus mainly on engagement rate because it shows when users actually interact with your content. Bounce rate is still useful for spotting pages where visitors leave too quickly, especially for paid ads and landing pages.
Conclusion
GA4 did not remove bounce rate. It reframed the whole system. Engagement rate is now the lead signal telling you people found value in your content. Bounce rate tells you who did not cross that threshold.
Use both. Lead with engagement rate when measuring content quality and organic traffic health. Watch bounce rate closely when diagnosing specific pages with quick exits, or when every click is costing you money in paid campaigns.
Understanding the numbers is the first step. Acting on what they tell you is what actually moves the needle.
