


You open your analytics dashboard and there it is: a 72% bounce rate. Panic sets in. Something must be wrong. Except, maybe nothing is wrong at all.
Bounce rate has been misread, misused, and misunderstood for over a decade. A single number that tells you someone left your site without clicking, but tells you nothing about whether they read your 2,000-word article, watched your product video, or actually wanted what you were selling.
Google noticed this too. When GA4 launched, bounce rate was quietly removed as a primary metric and replaced with something far more useful: Engagement Rate. And since then, a whole wave of smarter analytics tools has emerged that give you better signals with less noise.
In this guide, you will find the best bounce rate alternatives, both inside GA4 and across third-party platforms, plus a straight answer on when bounce rate still matters. If you have been wondering about the deeper connection between these two metrics, the engagement rate vs bounce rate breakdown on our site covers that in full detail.

Why Bounce Rate is Not Enough on Its Own
The original bounce rate definition is simple: a user lands on a page and leaves without visiting a second page. Google Analytics used to count this as a 100% bounce.
The problem? That definition punishes single-page experiences. A user who reads your entire blog post and leaves is counted the same as someone who clicks away in two seconds. A landing page designed for one action (sign up or call) will always show a high bounce rate, even when it is converting well.
There is also the question of whether it even affects Google rankings. The short version: Google does not use your GA bounce rate directly as a ranking signal. However, the user behavior that causes a high bounce rate (slow load times, irrelevant content, poor mobile experience) absolutely does.
So the goal is not to obsess over the number. The goal is to understand what your visitors are actually doing.
What Google Did: The GA4 Shift
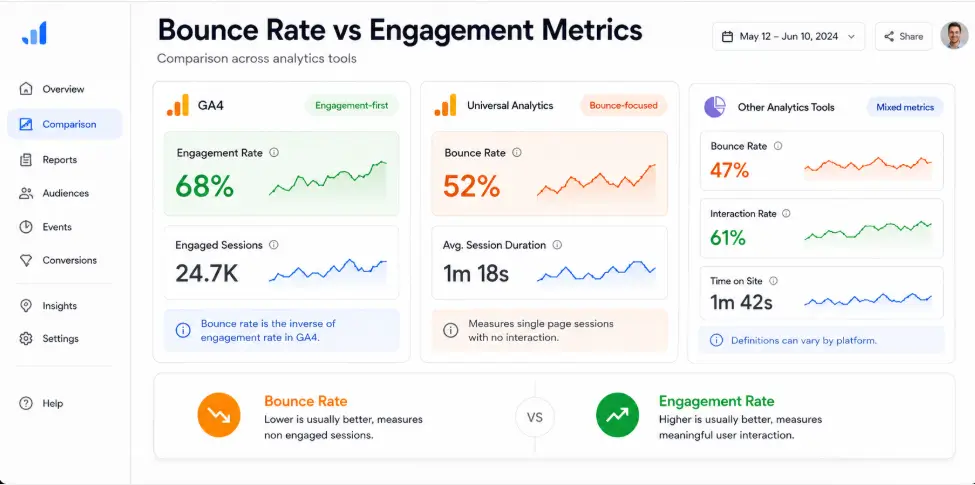
When Google Analytics 4 launched, bounce rate was removed from the default reports entirely. Its replacement was Engagement Rate, which is more honest about what actually happened during a visit.
A session is counted as engaged in GA4 when at least one of these is true:
- The session lasts longer than 10 seconds
- The user views at least 2 pages
- A conversion event fires
Everything else, including that 2-second exit, is counted as a non-engaged session. Bounce rate in GA4 is now simply the inverse: 100 minus your engagement rate. So if your engagement rate is 65%, your bounce rate is 35%.
Google later added bounce rate back as an optional column in GA4 after user feedback, but the primary metric they recommend tracking is engagement rate. That shift was deliberate, and for good reason.
Best Bounce Rate Metric Alternatives in Google Analytics 4
If you are staying with GA4, these are the metrics worth tracking instead of, or alongside, raw bounce rate.
1. Engagement Rate
This is the most direct replacement. It tells you what percentage of sessions were genuinely active rather than passive or accidental. A 60% engagement rate means 6 in 10 visitors did something meaningful on your site.
Where to find it in GA4: Reports > Acquisition > Traffic Acquisition. Add Engagement Rate as a column if it is not already visible.
According to Google’s GA4 documentation, engaged sessions are the recommended way to measure quality traffic in GA4.
2. Scroll Depth
Scroll depth tracking tells you how far down the page a user actually scrolled: 25%, 50%, 75%, or 90%. GA4 has this built in as a default scroll event, which fires when a user reaches 90% of page height.
For blog content and long-form pages, scroll depth is far more useful than bounce rate. A user who scrolls 90% of your article is clearly engaged, even if they leave without clicking anything else.
3. Average Engagement Time per Session
Previously called ‘Average Session Duration’ in Universal Analytics, this metric now only counts time when the browser tab is actually active. No more inflated numbers from users who left a tab open for an hour.
Average engagement time above 2 minutes is a strong signal for informational content. For ecommerce, you want a different target based on your funnel depth.
4. Exit Rate
Exit rate shows the percentage of users who left from a specific page, not just whether they bounced. This is more useful for diagnosing drop-off points in a funnel. A high exit rate on your checkout confirmation page is fine. A high exit rate on your pricing page is a problem worth investigating.
5. Page Value
Page Value assigns a monetary weight to pages based on whether they were in a session that eventually led to a conversion. It answers a question bounce rate never could: did this page contribute to revenue, even indirectly?
To use Page Value effectively, you need to set up goal values or ecommerce tracking in GA4.
Best Platform Alternatives to Google Analytics (with Better Metrics)
If you want to move beyond the Google ecosystem entirely, or simply want cleaner data and fewer compliance headaches, these tools each handle the bounce rate question differently.
Plausible Analytics
Plausible is the cleanest GA alternative for most sites. It is cookieless, GDPR compliant by default, and shows bounce rate alongside visit duration on a single-page dashboard. No setup needed. No cookie banners required.
What makes it better for bounce rate analysis: Plausible separates bounce rate by source, so you can immediately see that your Facebook traffic has a 90% bounce rate while your organic search visitors are at 40%. That context changes everything.
- Pricing: $9/month (up to 10K pageviews), scales up. Self-hosting is free.
- Free plan: Self-hosted only
- Best for: Bloggers, small businesses, privacy-conscious site owners
Matomo (Formerly Piwik)
Matomo is the closest like-for-like replacement for GA if you need full data ownership. You can self-host it on your own server, which means your data never leaves your infrastructure. GDPR compliance is baked in.
It tracks bounce rate, but also gives you individual visitor logs, heatmaps, session recordings, and form analytics. You can see exactly which pages have friction and why.
- Pricing: Free (self-hosted) or from $23/month (cloud-hosted)
- Best for: Enterprise sites, agencies, heavily regulated industries
Microsoft Clarity (Free)
This one surprises people. Microsoft Clarity is completely free, integrates with GA4 as a companion tool, and gives you heatmaps plus session recordings without any cost or pageview limit.
[IMAGE 3: Microsoft Clarity heatmap dashboard screenshot. Alt: ‘Microsoft Clarity heatmap bounce rate alternative free’]
Instead of a bounce rate number, Clarity shows you rage clicks (rapid frustrated clicks), dead clicks (clicks on non-interactive elements), and scroll engagement. These behavioral signals are often more actionable than any percentage figure.
- Pricing: Free, unlimited sites, unlimited sessions
- Best for: Any site owner who wants visual behavior data at zero cost
Clicky
Clicky gives you real-time visitor logs that show individual sessions: where users came from, which pages they viewed, how long they stayed, and what device they used. This level of detail is rare at its price point.
For bounce rate analysis, seeing a pattern in actual sessions (e.g., mobile users from Instagram consistently leave after 5 seconds) is far more useful than watching your average bounce rate drift up and down.
- Pricing: Free for up to 100K monthly pageviews. Paid from $9.99/month.
- Best for: Small to medium sites that want granular, real-time session data
Fathom Analytics
Fathom is built around privacy-first analytics with a clean, distraction-free interface. It tracks bounce rate and average visit duration, handles ad-blocker traffic better than most tools, and offers a straightforward GA migration assistant.
- Pricing: From $15/month, no free plan
- Best for: Agencies migrating clients off Google Analytics, sites with ad-heavy audiences
Quick Comparison: Bounce Rate Alternatives at a Glance
[IMAGE 4: Decision checklist graphic ‘How to choose the right analytics tool’. Alt: ‘How to choose the right bounce rate alternative for your website’]
| Metric / Tool | Tracks Bounce Rate? | Best Alternative Metric | Free Plan? | Best For |
| Google Analytics 4 | Yes (limited) | Engagement Rate | Yes | GA4 users |
| Plausible Analytics | Yes | Bounce Rate + Visit Duration | Self-host only | Privacy-first, simple view |
| Matomo | Yes | Actions per Visit, Heat Maps | Self-host free | GDPR, full data ownership |
| Microsoft Clarity | Yes | Rage Click Rate, Dead Clicks | Yes (free) | UX issues, visual behavior |
| Clicky | Yes | Real-time Visitor Logs | Yes (100K views) | Real-time granular data |
| Fathom Analytics | Yes | Average Visit Duration | No | GA migration, billing flex |
| Crazy Egg | Visual only | Scroll Maps, Heat Maps | No (trial) | Visual content analysis |
Which Alternative Should You Use?
The right choice depends on what question you are actually trying to answer.
If you want to know whether your content is being read: add scroll depth and engagement time in GA4. Both are free and already tracking in most GA4 setups.
If you want to find the page killing your conversions: look at exit rate by page in GA4, or use Microsoft Clarity to watch session recordings of users who left on that specific page.
If you want cleaner, simpler data without compliance headaches: switch to Plausible or Fathom as your primary analytics tool.
If you want full data control and detailed visitor logs: Matomo (self-hosted) or Clicky.
And if your bounce rate is high and you want to fix it at the source, the technical side of your site is often the first place to look. Our technical SEO guide covers the most common site speed and crawlability issues that push visitors out before they even read your content.
You can also read our detailed guide on how to reduce bounce rate for a step-by-step breakdown of what actually moves the number.
If you are unsure which metrics to track for your specific site or business model, our SEO consulting team can audit your current setup and build a measurement framework that makes sense for your goals.
Frequently Asked Questions
Is a 70% bounce rate good?
It depends on the page type and traffic source. A 70% bounce rate is normal, and often fine, for blog posts, news articles, and contact pages where the user gets what they need and leaves. It becomes a problem when it appears on high-intent pages like pricing, demo sign-up, or product pages. Always look at bounce rate by page type, not just site-wide.
Is a 40% bounce rate good?
A 40% bounce rate is generally considered strong for most website types. It means 60% of visitors viewed at least two pages or completed a meaningful action. For ecommerce and SaaS sites, anything under 50% is solid. But again, context matters more than the number itself.
Is there anything better than Google Analytics?
Depends on your definition of ‘better’. For simplicity and privacy, Plausible and Fathom are widely considered cleaner tools. For visual behavioral data, Microsoft Clarity (free) and Crazy Egg are stronger. For full data ownership, Matomo wins. GA4 is still the most comprehensive free option, but it has a steep learning curve and data sampling on higher traffic volumes.
How do you reduce bounce rate in Google Analytics?
Start by identifying which pages have the highest bounce rates and segment by traffic source. Organic traffic bouncing at 80% from a specific keyword usually means your content does not match search intent. Paid traffic with high bounce often means the ad and landing page are misaligned. Beyond content, page speed is the single biggest lever: a 1-second delay can increase bounce rate by 32%, according to Google’s PageSpeed research. You can also read more about the broader relationship between bounce behavior and rankings in our bounce rate vs pogo-sticking comparison.
Conclusion
Bounce rate was never the complete picture. It was a shortcut metric from an era when single-page visits were all we could measure. Today, between GA4’s engagement rate, scroll depth events, session recordings, and privacy-first platforms, you have no reason to make decisions based on one number.
The tools covered here give you a much clearer view of what visitors actually do, not just whether they stayed long enough to click a second link. Pick the metric that matches your question. Pick the platform that fits your workflow. Then use the data to make changes that actually matter.
