

How Many Times Should You Audit Your Site for SEO?

Most websites do not lose rankings overnight. They lose rankings quietly. A few broken internal links here. A few slow pages there. A few pages indexed but not ranking. Then one day traffic drops and everyone starts asking what happened. That is exactly why SEO audits matter. But auditing too often wastes time, while auditing too late costs rankings, leads, and sales. So, how many times should you audit your site for SEO? For most active websites, a full SEO audit every 3 to 6 months is the safest schedule. Small static websites may only need one every 6 to 12 months. Ecommerce sites, large blogs, and competitive websites usually need monthly checks plus a deeper quarterly audit. Quick Answer By Website Type The right audit schedule depends on how often your website changes and how much your business depends on organic traffic. Use this table as the starting point. Website Type Recommended Audit Frequency Why This Schedule Makes Sense Small static business site Every 6 to 12 months The site does not change often, so the risk is lower. Still, technical errors, outdated content, and tracking issues can build up. Local service business Every 3 to 6 months Local rankings, service pages, Google Business Profile signals, and competitors can shift quickly. Blog or content site Every 3 months New posts can create cannibalization, thin content, weak internal links, or outdated articles. Ecommerce website Monthly light audit, quarterly deep audit Product pages, filters, stock changes, duplicate URLs, and category pages create constant SEO risk. SaaS or lead generation site Every 3 months Landing pages, comparison pages, content assets, and conversion paths need regular checks. Large or high traffic website Monthly checks, quarterly full audit Small technical issues can affect many pages and a lot of traffic. Website after migration or redesign Before and after launch Redirects, canonicals, indexation, internal links, and tracking can break during the move. Why There Is No Single Perfect Audit Frequency A lazy answer is “audit your site regularly.” That advice is trash because it does not tell a business owner what to do next. A 10 page local plumbing website does not need the same audit schedule as a 5,000 page ecommerce store. A blog publishing 40 posts per month does not carry the same SEO risk as a small portfolio site that changes twice a year. Your audit frequency should depend on four things: How many pages your website has How often you publish or edit content How much revenue depends on organic traffic How often your rankings, competitors, or technical setup change If your website is simple, audit less often. If your website changes often or organic traffic brings real revenue, audit more often. For deeper issue discovery, connect this article naturally to SEO audit services. This is the most relevant internal link because the reader is already thinking about audit timing. SEO Audit Frequency By Audit Type Not every SEO check needs to be a full audit. This is where many site owners waste time. A quick GSC check is not the same as a complete SEO audit, and a full audit is not needed every week for most websites. Audit Type Best Frequency What To Check Technical SEO check Monthly for active sites, quarterly for smaller sites Crawl errors, indexation, sitemap, robots file, canonicals, redirects, site speed, mobile usability. Content audit Quarterly Outdated pages, cannibalization, thin content, poor search intent match, low CTR pages. On page audit Quarterly Titles, meta descriptions, headings, internal links, image alt text, schema, page intent. Backlink audit Quarterly or every 6 months Lost links, toxic patterns, irrelevant backlinks, anchor text issues, competitor authority gaps. Local SEO audit Every 3 months Google Business Profile, citations, reviews, location pages, map rankings, NAP consistency. Full SEO audit Every 3 to 6 months for active sites Technical, content, on page, off page, local, UX, analytics, and competitor gaps. Strategy audit Once or twice a year Keyword direction, topical authority, content roadmap, internal linking, and ROI. If the issue is crawlability, indexation, page speed, schema, redirects, or site architecture, send readers to technical SEO because this section is directly connected to technical audit work. When To Audit Outside Your Normal Schedule A fixed schedule is useful, but some moments should trigger an audit immediately. Waiting for the next quarterly review can be expensive. Trigger Audit Needed Why It Matters Organic traffic drops suddenly Immediate audit A drop can come from indexation issues, algorithm impact, lost links, content decay, or technical errors. Website redesign Before and after launch Design changes can break headings, internal links, speed, tracking, and crawl paths. Site migration Before launch, launch day, 2 weeks after launch Redirects, canonicals, XML sitemaps, URL structure, and indexation must be checked. Major Google update Light audit first, deeper audit if traffic changes You need to compare affected pages, intent match, content quality, and ranking signals. Large content push Audit after publishing cycle New content can create duplication, weak internal linking, and keyword overlap. New CMS, theme, or plugin Immediate technical check CMS changes can affect speed, schema, noindex tags, canonical tags, and page templates. Important page indexed but not ranking Immediate page level audit Indexing alone does not mean Google sees enough relevance, quality, authority, or intent match. If a page is already indexed but still invisible in search, link to indexed not ranking because that problem needs a page level diagnosis, not just a normal audit schedule. Daily, Weekly, Monthly, Quarterly, And Yearly SEO Checks Here is the cleanest way to think about it. You do not need a full audit every day. You need monitoring often and deep review on a set schedule. Timeframe What To Do Tools To Use Daily Check sudden traffic drops, conversion issues, website downtime, and important alerts. Google Analytics, Search Console, uptime monitor. Weekly Review impressions, clicks, top losing pages, indexing alerts, and major ranking movement. Google Search Console, rank tracker, analytics. Monthly Run a light technical and content health check
Website Indexed But Not Ranking? Here Is What to Fix First
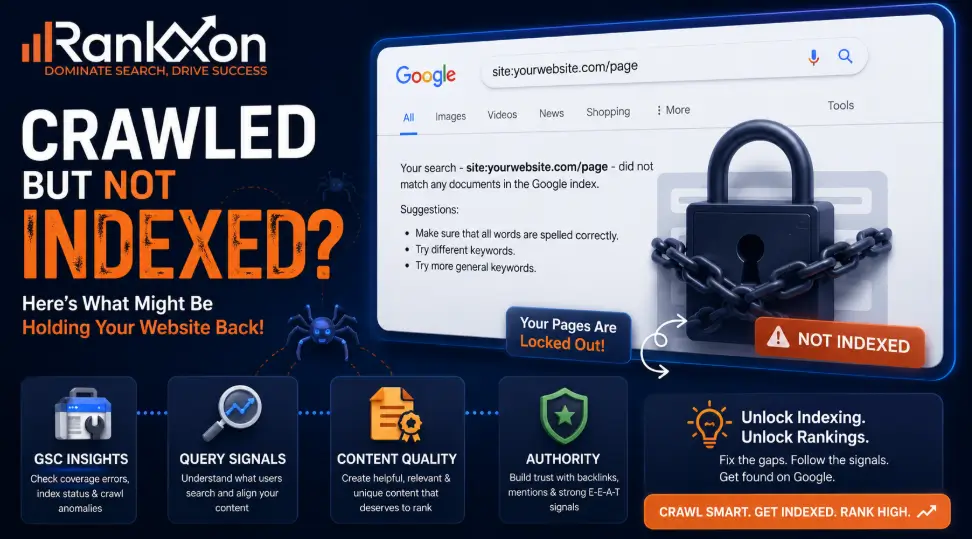
Your page is indexed. Google Search Console says it is on Google. You search your target keyword, and nothing shows. Not page one. Not page five. Sometimes not even for a phrase you wrote yourself. That is the moment most site owners panic and start doing random SEO work. They publish more blogs. They buy weak backlinks. They request indexing again and again. None of that fixes the real problem if Google already knows the page exists but does not see it as the best result for any useful query. Here is the truth: indexing is only entry into the database. Ranking is permission to compete. If your website is indexed but not ranking, your page has passed discovery, but it has failed relevance, quality, authority, internal context, or query competition. Indexed Means Found, Not Chosen When a website is indexed but not ranking, it means Google has found the page, processed it, and stored it in the index, but does not consider it strong enough to show for the queries you care about. This can happen for a few reasons. Your page may not match search intent. The content may be too thin. Google may have selected another canonical URL. Your internal links may be weak. Your competitors may have stronger authority, clearer topical coverage, or better user satisfaction signals. The fix is not to keep pressing “request indexing.” The fix is to find out why the page is not being served for real queries. Crawling vs Indexing vs Ranking Crawling means Googlebot discovers and downloads your page. Indexing means Google analyzes the page, understands its content, and stores it in Google’s index. Ranking means Google chooses your page as one of the best answers for a specific search query. These are three different stages. A page can be crawled but not indexed. A page can be indexed but not shown. A page can show for one weak query but fail for the main keyword. That last part matters. A website does not rank in a general sense. It ranks for specific keywords, locations, devices, and search intents. So the right question is not “why is my site not ranking?” The right question is “which query should this page rank for, and why would Google choose it over the current results?” First Diagnosis: No Impressions or Bad Rankings? Open Google Search Console and check the page in the Performance report. Filter by exact URL. Then check queries, impressions, clicks, and average position. If the page has zero impressions, Google is not serving it for meaningful queries yet. That points to weak relevance, poor internal context, canonical confusion, low authority, or a keyword target that is too hard for the site. If the page has impressions but poor average position, Google understands the page but does not trust it enough or does not see it as better than current results. That points to content depth, search intent, freshness, links, page experience, or weak click appeal. To understand which signals actually matter, review the main ranking factors that influence visibility. This one step saves weeks. No impressions and poor rankings are not the same problem. The 8 Most Common Reasons Your Indexed Page Is Not Ranking 1. The Page Targets the Wrong Search Intent This is the biggest reason indexed pages fail. The page talks about the keyword, but it does not solve the searcher’s real problem. For example, if someone searches “website indexed but not ranking,” they are probably not looking for a broad SEO sales page. They want a diagnosis. They want to know what to check first in Google Search Console, whether this is normal, and how to fix it without wasting money. Check the top ranking pages. Are they guides, forum threads, tool pages, checklists, service pages, or case studies? If Google is ranking diagnosis guides and your page is a sales pitch, you are fighting the wrong battle. 2. The Content Is Too Weak to Compete Thin content can still get indexed. That does not mean it deserves rankings. Google can index weak pages because they exist, but ranking requires usefulness. Weak content usually has surface level advice, no examples, no screenshots, no original experience, no tables, no clear next step, and no proof that the writer understands the problem. Improve the page by adding a diagnostic process, real examples, GSC checks, competitor comparison, common mistakes, and a clear action plan. Do not just add more words. Add better decisions. This is where strong on page SEO matters, because the page needs better intent match, headings, content structure, and internal context. 3. Google Chose Another Canonical Page Sometimes your page is indexed, but Google prefers another URL as the canonical version. This can happen with duplicate pages, similar service pages, tag pages, filtered eCommerce URLs, HTTP and HTTPS versions, or copied content. Use URL Inspection and check the user declared canonical and Google selected canonical. If they do not match, find out why. Google may think another page is more representative, cleaner, stronger, or less duplicated. Fix this with cleaner canonical tags, better internal links, merged duplicate content, redirects where needed, and stronger differentiation between similar pages. 4. Internal Links Are Not Passing Enough Context A page can be indexed because it appears in the sitemap, but still be weak because the site structure does not support it. Internal links help Google understand which pages matter, how topics connect, and what anchor text describes the page. If a new article has no internal links from relevant older pages, it starts with very little context. For Rankxon, this article should naturally connect to technical SEO, Google ranking factors, page speed, mobile first indexing, HTTPS, product page SEO, and category page SEO. Use short anchor text such as technical SEO, ranking factors, page speed, mobile indexing, HTTPS SEO, product SEO, and category SEO. 5. Your Page Has No Topical Support One isolated article rarely ranks in a competitive SEO topic. Google needs repeated evidence that your website
What Is Mobile First Indexing? Meaning, SEO Impact, And Fixes
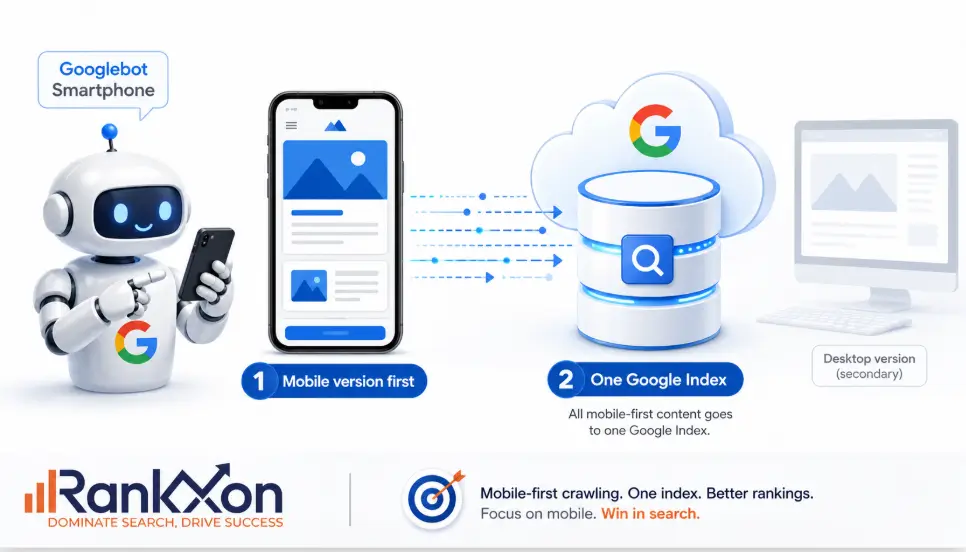
Your desktop website can look perfect and still lose visibility if the mobile version is weak. That is the part many site owners miss. Google does not simply admire your desktop layout and ignore the phone experience. For most websites, the mobile page is the version Google mainly uses to understand, index, and rank the content. That means one hidden mobile section, one blocked script, one missing product description, or one slow mobile template can create a real SEO problem. Mobile first indexing is not just a design topic. It is a crawling, indexing, content, speed, and user experience issue. What Mobile First Indexing Means Mobile first indexing means Google mainly uses the mobile version of your page for indexing and ranking. Google still has one index. It does not keep a separate mobile index and desktop index for normal search results. The important point is this: the mobile version becomes the main source Google uses to understand your page. In simple words, if your desktop page has full content but your mobile page has missing text, missing headings, weak internal links, missing schema, or broken images, Google may understand less about the page than you think. Google explains that it uses the mobile version of a site’s content, crawled with the smartphone agent, for indexing and ranking. That makes your mobile page the real SEO version of the page in most cases. Why Google Uses Your Mobile Page First Google moved toward mobile first indexing because most users browse and search on phones. A search result that looks useful on desktop but fails on mobile is not helpful for the majority of users. So Google wants to evaluate the version that real users are most likely to see. This shift started years ago and became the normal state of Google indexing. Google also confirmed that mobile first indexing had fully arrived, which means this is not a future trend. It is already how modern SEO works. For website owners, the lesson is simple. Stop treating mobile as a smaller afterthought. Your mobile page is not a backup design. It is the version that can decide how clearly Google understands your content. Does Mobile First Indexing Affect Rankings? Yes, but not in the lazy way many people explain it. Mobile first indexing itself is about which version Google uses for indexing and ranking. It does not mean every mobile issue is a direct penalty. The real risk is that Google may crawl a weaker version of your page. If the mobile page has less useful content, fewer links, missing structured data, poor image setup, slow loading, or annoying popups, your SEO performance can suffer. The ranking problem comes from what Google can access, understand, and trust on the mobile version. Mobile Issue Why It Matters For SEO Fix Important text missing on mobile Google may not see enough content to understand the page fully. Keep primary content equivalent across mobile and desktop. Different headings on mobile Topic signals may become weaker or confusing. Use clear, meaningful headings on both versions. Schema only on desktop Rich result and entity signals may be incomplete. Add the same structured data on mobile. Internal links hidden on mobile Google may discover fewer related pages and understand site structure poorly. Keep useful navigation and contextual links visible or crawlable. Slow mobile layout Poor page experience can hurt users and conversions. Improve Core Web Vitals and mobile speed. Intrusive popups Users cannot reach the content easily. Use clean, non intrusive mobile CTAs. Mobile First Indexing Versus Mobile Friendly Design These two terms are related, but they are not the same thing. Term Meaning Simple Example Mobile first indexing Google mainly uses your mobile page for indexing and ranking. Googlebot Smartphone reads your mobile content to understand the page. Mobile friendly design Your page works properly on a phone. Text is readable, buttons are easy to tap, and layout fits the screen. Mobile optimized SEO Your mobile page is useful, fast, complete, crawlable, and conversion focused. The mobile page has the same main content, links, schema, images, and clear UX. A page can be mobile friendly and still weak for mobile indexing. For example, the design may fit the screen, but the mobile version may hide FAQs, remove internal links, or load main content only after a user taps a button. That is where many SEO problems start. If you want a deeper guide on whether mobile usability is part of modern SEO performance, read RankXon’s guide on mobile friendliness. What Website Owners Must Keep The Same On Mobile And Desktop The safest rule is content parity. Your mobile page does not need to look identical to desktop, but it should give Google and users access to the same important information. You can use accordions, tabs, and shorter layouts, but the main content should still be present and accessible. Element Should It Match? Why Main content Yes Google uses mobile content to understand page relevance. Title tag Equivalent The page topic and search snippet should stay consistent. Meta description Equivalent Snippet messaging should not conflict between versions. H1 and headings Equivalent Headings guide topic understanding and reader flow. Structured data Yes Schema helps search engines understand entities, products, breadcrumbs, videos, and page type. Images and alt text Yes Visual content can support rankings, image search, and accessibility. Internal links Yes Links help discovery, topic connection, and crawl flow. Robots meta tags Yes A wrong noindex or nofollow on mobile can damage indexing. For broader ranking context, connect this article naturally to RankXon’s guide on SEO ranking factors, because mobile performance works with many other signals. Common Mobile Indexing Mistakes That Hurt SEO 1. Removing content from mobile pages This is the most dangerous mistake. Many designers remove long product descriptions, FAQs, comparison tables, reviews, or service details from mobile to make the page look cleaner. Cleaner is good, but removing the content completely is risky. If Google sees less content on mobile, it
HTTP or HTTPS, Which Is Faster?
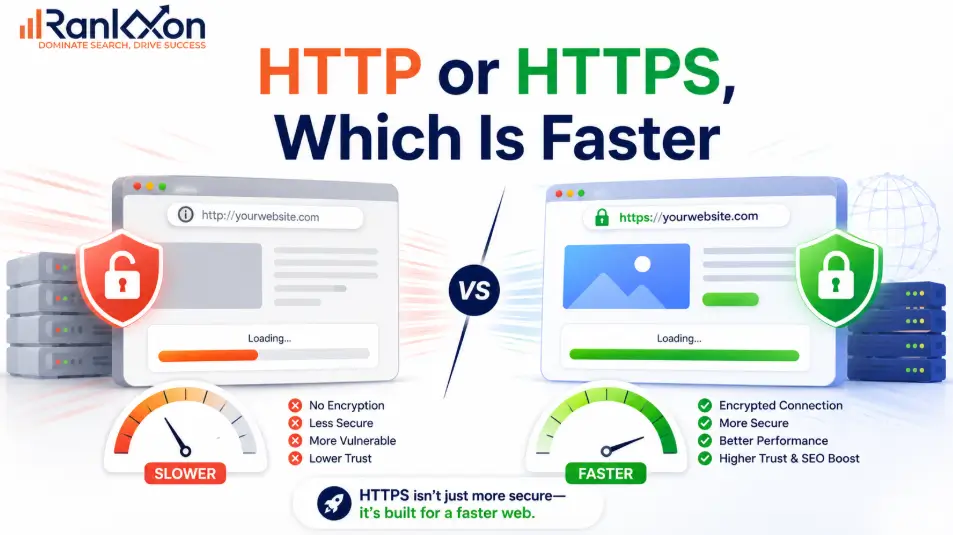
Most people think HTTPS is slower because it adds encryption. That used to make sense. But today, that answer is incomplete. A plain HTTP page may look lighter on paper, but modern HTTPS can load faster when it uses HTTP/2, HTTP/3, proper caching, compression, and a CDN. The real speed difference is not just HTTP vs HTTPS. It depends on how your server, SSL certificate, browser, and website resources are configured. So if your site still runs on HTTP because you’re afraid HTTPS will slow it down, you may be protecting the wrong thing. This guide explains which one is actually faster, when HTTPS can beat HTTP, and what setup mistakes can make a secure website feel slow. HTTP Is Faster in Theory, HTTPS Is Better in Real Browsing HTTP is technically faster for a single request because it does not need encryption setup. HTTPS adds a TLS handshake before data transfer, so it has a small upfront cost. But that answer is incomplete. Modern websites are not judged by one isolated request. In real browsing, HTTPS often performs better because browsers commonly use HTTP/2 and HTTP/3 over secure connections. These newer protocols can load several assets more efficiently, reduce repeated connection overhead, and improve how page resources are delivered. For users and SEO, the practical answer is clear. Use HTTPS. Then make it fast with proper redirects, caching, HTTP/2 or HTTP/3, CDN support, compressed assets, and clean technical SEO. Why Plain HTTP Can Win in a Tiny Test HTTP does not encrypt the connection. The browser sends a request, the server responds, and the data moves in plain text. That makes the first connection simpler. HTTPS adds TLS. Before the browser and server exchange page data, they confirm identity, agree on encryption details, and create a secure session. This step protects the user, but it can add a small delay at the start of the connection. That is why developers sometimes say HTTP is faster. In a lab test where one small file is loaded once, HTTP may finish first. The problem is that this test does not represent how most websites work. Real pages do not load one file. They load many resources. They reuse connections. They cache assets. They often run through CDNs. They may use modern protocols. They have redirects, scripts, fonts, and third party requests. Once all of that is included, the basic HTTP vs HTTPS theory becomes less useful. Why HTTPS Often Loads Faster on Modern Websites HTTPS can feel faster in real use because it is the normal path to modern browser performance. Most major browsers support HTTP/2 over secure connections. HTTP/2 improves how page assets are transferred compared with older HTTP/1.1. The biggest advantage is multiplexing. Instead of opening many separate connections or waiting in line for one request to finish before another moves properly, HTTP/2 can send multiple requests over one connection. It also compresses headers and uses a binary format, which can reduce waste during repeated requests. HTTP/3 can improve this further by using QUIC instead of traditional TCP. That can reduce connection delays and improve performance on unstable networks. Again, the win is not because encryption itself is faster. The win comes from the modern protocol stack that usually arrives with HTTPS. This is the nuance most articles miss: HTTPS is not faster because security adds speed. HTTPS is faster in many real cases because modern browsers, CDNs, and web servers give secure sites access to newer delivery methods. HTTP vs HTTPS Speed Comparison Table Scenario Which can be faster? Why it happens SEO decision Single tiny request in a lab HTTP No TLS handshake. Not a good reason to use HTTP. Modern website using HTTP/2 HTTPS Multiplexing and header compression can improve delivery. Use HTTPS. Modern website using HTTP/3 HTTPS QUIC can reduce connection delay on some networks. Use HTTPS and test results. Poor HTTPS setup with redirect chains HTTP may feel faster Bad redirects add delay before the page loads. Fix the migration. Do not return to HTTP. HTTPS with CDN and caching HTTPS TLS can terminate closer to the user and cached assets load faster. Best practical setup. Expired or misconfigured SSL Neither Users see warnings or blocked pages. Fix immediately. Where HTTPS Can Become Slower HTTPS usually becomes slow because of setup mistakes, not because HTTPS is bad. The most common problem is redirect waste. If a page moves from http://example.com to http://www.example.com to https://www.example.com, every extra step adds time before the browser gets the final page. Another issue is mixed content. This happens when the page loads on HTTPS but images, scripts, CSS, fonts, or iframes still use HTTP. Browsers may block those resources or show warnings. That can hurt trust, layout, and speed. For a deeper fix, read Rankxon’s mixed content guide. HTTPS can also feel slow when the server is weak, the certificate chain is poorly configured, caching is missing, images are heavy, JavaScript blocks rendering, or the site forces browsers to download the same assets again and again. So the right question is not, should I remove HTTPS to make the site faster? The right question is, what part of my HTTPS setup is wasting time? Does HTTPS Help SEO and Page Experience? Yes, HTTPS matters for SEO, but do not oversell it. Google has used HTTPS as a ranking signal for years, but it is not stronger than content quality, relevance, links, intent match, or user satisfaction. It is better understood as a trust and page experience baseline. Google’s own page experience guidance asks whether pages are served in a secure fashion. That means HTTPS is part of the experience users and search engines expect from a modern website. The real SEO value comes from clean implementation. Google should see one preferred HTTPS version of every important page. Your canonical tags, sitemap URLs, internal links, redirects, hreflang tags, and structured data URLs should all point to the secure version. If you want the full SEO view, read Rankxon’s
Mixed Content Error: How to Find and Fix HTTPS Warnings

Your SSL certificate can be installed correctly and your website can still show a security warning. That is the part most website owners do not understand. The problem is not always the SSL. The real problem is often hidden inside the page. Your main page may load through HTTPS, but some files inside that page may still load through HTTP. That can include images, CSS files, JavaScript, fonts, videos, forms, iframes, tracking scripts, or old links left behind after a website migration. That is what creates a mixed content error. And yes, it matters. A mixed content warning can make your website look unsafe, break design elements, block scripts, hurt user trust, and create technical SEO problems if important page resources fail to load properly. The good news is simple. Once you find the exact HTTP file causing the issue, the fix becomes much easier. What Is a Mixed Content Error? A mixed content error happens when a secure HTTPS page loads one or more insecure resources through HTTP. In simple words, the page itself is secure, but some files inside the page are not. For example, your website URL may open with HTTPS, but one image, script, font, or stylesheet may still come from an old HTTP link. Browsers see that as a risk because insecure resources can be changed or intercepted before they reach the user. This is why the browser may remove the secure padlock, show a warning, block the file, or display a message like blocked mixed content. As explained above, SSL alone does not clean every old URL inside your website. That is why the next section matters. Why Your HTTPS Site Still Shows Not Secure If your website still shows Not Secure after SSL installation, do not panic. It usually means one of these things is happening. Your SSL certificate is active, but some internal files still use HTTP. Your theme, plugin, page builder, or database still contains old HTTP links. A third party script is being loaded from an insecure source. Your CDN is serving the page securely, but some assets still use insecure URLs. Cache, CDN, and blocked files can also create load speed issues, especially when key scripts or styles fail to load. Your browser or website cache is still showing old files. This is the exact reason many people install SSL, refresh the website, and still see a warning. The certificate secures the connection, but the page still has insecure pieces inside it. Now we need to look at what usually causes those insecure pieces. What Causes Mixed Content Errors? Mixed content usually comes from old URLs, hardcoded assets, poor migration work, or external files that do not support HTTPS. Here is the practical breakdown. Resource Type Common Cause Risk Level What To Check Images Old media URLs after HTTPS migration Medium Media library, page content, builder blocks CSS files Theme or plugin loading old stylesheet links High Theme files, cache, page builder settings JavaScript Old script links or third party tools High Header scripts, tracking tools, plugins Fonts Font files loaded through HTTP Medium Theme settings, font plugin, custom CSS Iframes Embedded maps, videos, forms, or widgets High Embed code, form tools, booking tools API requests Forms or apps sending data to HTTP endpoint Critical Form plugin, custom app, checkout flow CDN assets CDN serving old HTTP paths High CDN settings, cache rules, origin URLs The most dangerous ones are CSS, JavaScript, iframes, forms, and API requests. If those break, your page can lose layout, tracking, forms, cart functions, or important conversion elements. Images can also cause warnings, but blocked scripts and stylesheets are usually more serious. Active vs Passive Mixed Content Not every mixed content issue behaves the same way. Some resources may be upgraded by the browser. Others may be blocked. MDN explains this as upgradable content and blockable content. Images, audio, and video may often be upgraded. Scripts, stylesheets, iframes, and other sensitive resources are more likely to be blocked. MDN explains how browsers treat blocked resources, which is why scripts, stylesheets, and iframes need extra attention. This matters because two pages can have mixed content but show different behavior. One page may still look normal because only an image has an insecure URL. Another page may look broken because the CSS file or JavaScript file was blocked. So do not just ask, Do I have mixed content? Ask, Which file is insecure, and does that file affect page function? That is where real troubleshooting starts. How to Check Mixed Content Errors in Chrome The fastest way to find mixed content is through your browser. Open the affected page in Chrome. Right click on the page and choose Inspect. Go to the Console tab. Refresh the page. Look for mixed content warnings. Copy the HTTP resource URL shown in the warning. The warning usually tells you the exact HTTP resource causing the issue. It may show an insecure image, stylesheet, script, font, iframe, or request. Once you find the URL, do not change random settings. First ask where that resource is coming from. Is it from your own website, a plugin, a theme, a page builder, a CDN, or a third party tool? This matters because the correct fix depends on the source. How to Fix Mixed Content Errors The right fix is not always install a plugin. That advice is weak. The real fix is to update the insecure resource at its source. For larger sites, this type of technical cleanup should be handled page by page, not guessed through plugins. Start with the file shown in the browser console. If the file belongs to your own website, update it from HTTP to HTTPS or use a clean relative path if it is an internal asset. If the file comes from a third party tool, check whether that tool supports HTTPS. If it does, update the link. If it does not, remove it or replace it with a safer option. If the issue
HTTP to HTTPS Migration: The Complete Step-by-Step Guide (Without Losing Rankings)

Your browser just flagged another site as “Not Secure.” That warning? It costs real money. Studies show that even a single security warning reduces conversions by up to 20%, and Google has been using HTTPS as a ranking factor since 2014. If your site is still running on HTTP in 2025, you’re not just losing trust. You’re leaving rankings on the table. This guide walks you through the entire HTTP to HTTPS migration process, step by step. No fluff, no skipped parts. Whether you’re on WordPress, Apache, Nginx, or Cloudflare, you’ll find exactly what to do here and, just as importantly, what not to do. What Is HTTP to HTTPS Migration (and What Actually Changes) HTTP (HyperText Transfer Protocol) sends data between your browser and server in plain text. Anyone on the same network can read it. HTTPS adds a layer of encryption using SSL/TLS certificates, so data is scrambled before it travels. When you migrate from HTTP to HTTPS, three things happen: Authentication: Visitors reach your actual server, not an impersonator. Encryption: Data in transit cannot be read by third parties. Data integrity: Content can’t be tampered with between server and browser. For everyday blogs and business sites, the login page alone is reason enough. Without HTTPS, your admin username and password travel across the internet as plain text. How HTTPS Affects Your SEO Rankings Google officially confirmed HTTPS as a ranking signal back in 2014. It started as a lightweight factor, but its weight has only grown since. Today, nearly all pages ranking on the first page of Google are served over HTTPS. Here’s what the migration directly impacts from an SEO perspective: SEO Factor Before (HTTP) After (HTTPS) Ranking Signal Weak / none Active positive signal Chrome Browser Label “Not Secure” warning Padlock icon Referral Data (Analytics) Often lost, shows as Direct Passed correctly HTTP/2 Access Not available Enabled (faster load) User Trust Lower Higher Core Web Vitals Slower (HTTP/1.1 only) Faster via HTTP/2 One thing competitors rarely mention: referral data loss. If your site is on HTTP and someone shares your link from an HTTPS site like Reddit or LinkedIn, Google Analytics records that visit as “Direct” traffic. You lose insight into where your audience is coming from. Migrate to HTTPS and that data comes back. For a deeper look at how security changes affect your search presence, see our guide on the impact of HTTPS on SEO. Step 1: Get Your SSL Certificate You can’t run HTTPS without an SSL certificate. Here are your options: Free Option: Let’s Encrypt Let’s Encrypt is a free, automated certificate authority. Most hosting providers now offer it with one click through cPanel or Plesk. If your host doesn’t offer it natively, Certbot is the recommended tool to install it manually. Valid for 90 days, but auto-renews Trusted by all major browsers No paperwork or payment required Paid SSL Certificates For businesses that need extended validation (the type that shows your company name in the address bar), paid certs from Comodo, DigiCert, or GlobalSign are the way to go. A basic domain validation cert runs under $10/year. Certificate Type Cost Validation Best For Domain Validation (DV) Free (Let’s Encrypt) or under $10/yr Email only Blogs, small sites Organization Validation (OV) $30-$100/yr Business documents Business websites Extended Validation (EV) $100-$300/yr Full legal verification Banks, ecommerce Wildcard SSL $70-$200/yr Email only Sites with subdomains Step 2: Install the Certificate on Your Server [ IMAGE: Screenshot: cPanel SSL/TLS section with Let’s Encrypt install screen ] Most managed hosting panels (cPanel, Plesk, Kinsta, WP Engine) handle installation automatically once you issue the cert. For VPS or dedicated servers, here’s the manual process. Apache Locate your virtual host config (usually at /etc/apache2/sites-available/yourdomain.conf) and add the paths to your certificate file, private key, and certificate chain. Restart Apache after saving. Nginx Open your server block config and point ssl_certificate to your .crt file and ssl_certificate_key to your .key file. Add ssl_protocols TLSv1.2 TLSv1.3 for modern security. Reload Nginx. After installation, verify the cert is active using SSL Labs’ free test at ssllabs.com/ssltest. Aim for an A or A+ rating. Step 3: Set Up 301 Redirects A 301 redirect tells search engines that your HTTP URLs have permanently moved to HTTPS. This is the most important SEO step in the whole process. Get this wrong and you’ll split your link equity between two versions of your site. Apache (.htaccess) Add these lines to the top of your .htaccess file: RewriteEngine On RewriteCond %{HTTPS} off RewriteRule ^(.*)$ https://%{HTTP_HOST}%{REQUEST_URI} [L,R=301] Nginx Add a separate server block that handles port 80 and returns a 301 to the HTTPS version: server { listen 80; server_name yourdomain.com www.yourdomain.com; return 301 https://$host$request_uri; } Cloudflare If you’re using Cloudflare, go to SSL/TLS > Edge Certificates and toggle “Always Use HTTPS” to on. Cloudflare handles the redirect at the CDN level, no server config needed. One thing to check: make sure you’re doing a single redirect, not a chain. HTTP > HTTPS is fine. HTTP > HTTP www > HTTPS www is three hops and slows your site. Step 4: Fix Mixed Content Errors Mixed content happens when your page loads over HTTPS but still calls resources (images, scripts, stylesheets) over HTTP. Chrome shows a broken padlock, and some browsers block the resources entirely. How to find them: Open Chrome DevTools (F12) and check the Console tab for mixed content warnings Use the free tool WhyNoPadlock.com to scan your URLs Run a site crawl with Screaming Frog or Sitebulb How to fix them: Hardcoded HTTP links in content: Do a database search and replace (more on this in Step 5 for WordPress). External scripts/fonts: Update the src attribute from http:// to https://, or use protocol-relative URLs (//). CDN resources: Update the origin URL in your CDN settings to use HTTPS. Step 5: Update WordPress Database URLs If you’re on WordPress, your database contains thousands of hardcoded HTTP references: post content, metadata, widget settings, theme options. You need to update them all. Option A: WP-CLI
Best Bounce Rate Alternatives in Google Analytics and Beyond
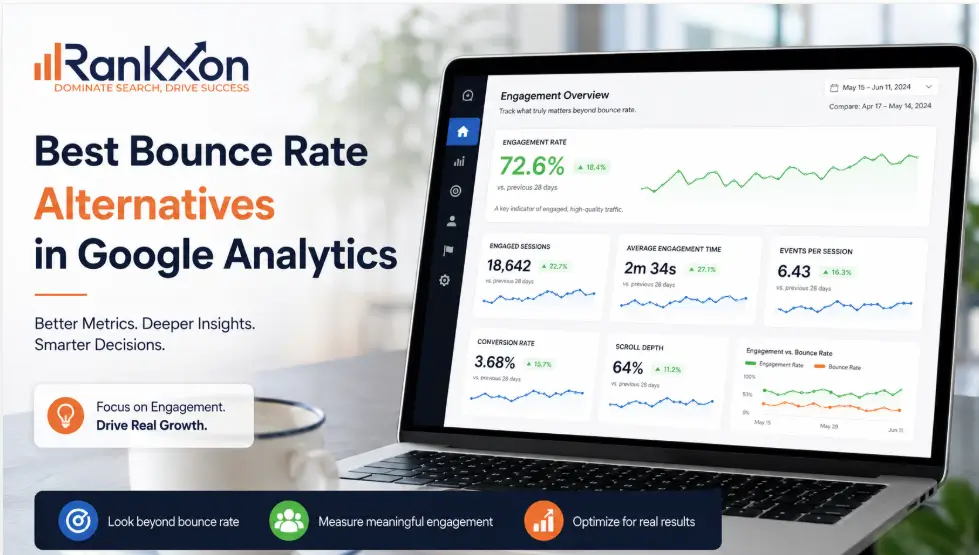
You open your analytics dashboard and there it is: a 72% bounce rate. Panic sets in. Something must be wrong. Except, maybe nothing is wrong at all. Bounce rate has been misread, misused, and misunderstood for over a decade. A single number that tells you someone left your site without clicking, but tells you nothing about whether they read your 2,000-word article, watched your product video, or actually wanted what you were selling. Google noticed this too. When GA4 launched, bounce rate was quietly removed as a primary metric and replaced with something far more useful: Engagement Rate. And since then, a whole wave of smarter analytics tools has emerged that give you better signals with less noise. In this guide, you will find the best bounce rate alternatives, both inside GA4 and across third-party platforms, plus a straight answer on when bounce rate still matters. If you have been wondering about the deeper connection between these two metrics, the engagement rate vs bounce rate breakdown on our site covers that in full detail. Why Bounce Rate is Not Enough on Its Own The original bounce rate definition is simple: a user lands on a page and leaves without visiting a second page. Google Analytics used to count this as a 100% bounce. The problem? That definition punishes single-page experiences. A user who reads your entire blog post and leaves is counted the same as someone who clicks away in two seconds. A landing page designed for one action (sign up or call) will always show a high bounce rate, even when it is converting well. There is also the question of whether it even affects Google rankings. The short version: Google does not use your GA bounce rate directly as a ranking signal. However, the user behavior that causes a high bounce rate (slow load times, irrelevant content, poor mobile experience) absolutely does. So the goal is not to obsess over the number. The goal is to understand what your visitors are actually doing. What Google Did: The GA4 Shift When Google Analytics 4 launched, bounce rate was removed from the default reports entirely. Its replacement was Engagement Rate, which is more honest about what actually happened during a visit. A session is counted as engaged in GA4 when at least one of these is true: The session lasts longer than 10 seconds The user views at least 2 pages A conversion event fires Everything else, including that 2-second exit, is counted as a non-engaged session. Bounce rate in GA4 is now simply the inverse: 100 minus your engagement rate. So if your engagement rate is 65%, your bounce rate is 35%. Google later added bounce rate back as an optional column in GA4 after user feedback, but the primary metric they recommend tracking is engagement rate. That shift was deliberate, and for good reason. Best Bounce Rate Metric Alternatives in Google Analytics 4 If you are staying with GA4, these are the metrics worth tracking instead of, or alongside, raw bounce rate. 1. Engagement Rate This is the most direct replacement. It tells you what percentage of sessions were genuinely active rather than passive or accidental. A 60% engagement rate means 6 in 10 visitors did something meaningful on your site. Where to find it in GA4: Reports > Acquisition > Traffic Acquisition. Add Engagement Rate as a column if it is not already visible. According to Google’s GA4 documentation, engaged sessions are the recommended way to measure quality traffic in GA4. 2. Scroll Depth Scroll depth tracking tells you how far down the page a user actually scrolled: 25%, 50%, 75%, or 90%. GA4 has this built in as a default scroll event, which fires when a user reaches 90% of page height. For blog content and long-form pages, scroll depth is far more useful than bounce rate. A user who scrolls 90% of your article is clearly engaged, even if they leave without clicking anything else. 3. Average Engagement Time per Session Previously called ‘Average Session Duration’ in Universal Analytics, this metric now only counts time when the browser tab is actually active. No more inflated numbers from users who left a tab open for an hour. Average engagement time above 2 minutes is a strong signal for informational content. For ecommerce, you want a different target based on your funnel depth. 4. Exit Rate Exit rate shows the percentage of users who left from a specific page, not just whether they bounced. This is more useful for diagnosing drop-off points in a funnel. A high exit rate on your checkout confirmation page is fine. A high exit rate on your pricing page is a problem worth investigating. 5. Page Value Page Value assigns a monetary weight to pages based on whether they were in a session that eventually led to a conversion. It answers a question bounce rate never could: did this page contribute to revenue, even indirectly? To use Page Value effectively, you need to set up goal values or ecommerce tracking in GA4. Best Platform Alternatives to Google Analytics (with Better Metrics) If you want to move beyond the Google ecosystem entirely, or simply want cleaner data and fewer compliance headaches, these tools each handle the bounce rate question differently. Plausible Analytics Plausible is the cleanest GA alternative for most sites. It is cookieless, GDPR compliant by default, and shows bounce rate alongside visit duration on a single-page dashboard. No setup needed. No cookie banners required. What makes it better for bounce rate analysis: Plausible separates bounce rate by source, so you can immediately see that your Facebook traffic has a 90% bounce rate while your organic search visitors are at 40%. That context changes everything. Pricing: $9/month (up to 10K pageviews), scales up. Self-hosting is free. Free plan: Self-hosted only Best for: Bloggers, small businesses, privacy-conscious site owners Matomo (Formerly Piwik) Matomo is the closest like-for-like replacement for GA if you need full data ownership. You can self-host it on your
Engagement Rate vs Bounce Rate: Which Metric Matters More in GA4? (2026)
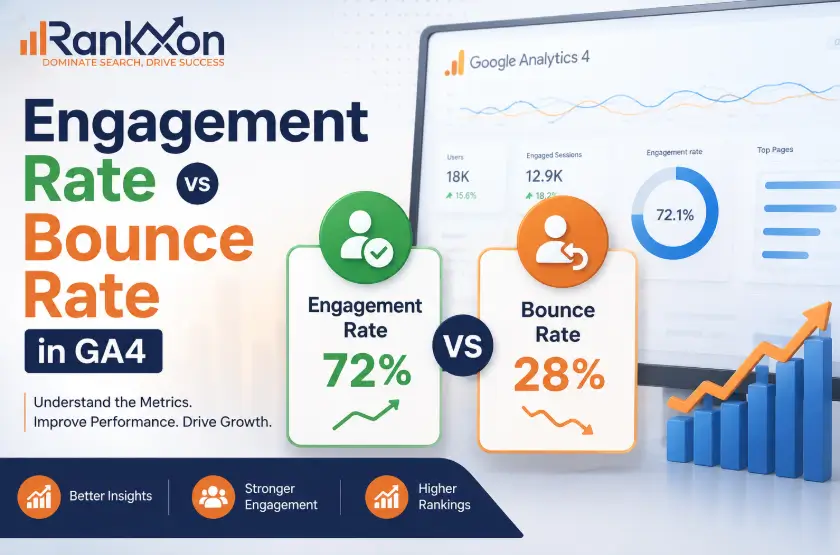
If you switched from Universal Analytics to GA4 and suddenly could not find bounce rate, you were not alone. Thousands of marketers panicked. Some thought it was gone. It was not. GA4 just pushed it to the back seat and gave a better metric the front row. That metric is engagement rate. Once you understand how the two work together, you will read your analytics in a completely different way. What Changed When GA4 Replaced Universal Analytics Universal Analytics defined a bounce as anyone who landed on a page and left without clicking anything else. That sounds logical until you think about it more carefully. Someone could spend 8 minutes reading a 2,000-word article, absorb every word, and UA would still label them a bouncer. That is a terrible way to measure whether your content is working. GA4 fixed this by flipping the framework. Instead of tracking what did not happen, it tracks what did. Bounce rate did not disappear. It just became the leftover after engagement rate is calculated. The two are now mathematically linked, which makes the whole system cleaner. What Is Engagement Rate in GA4 Engagement rate is the percentage of sessions where a user did something meaningful on your site. A session counts as engaged if any one of these conditions is met: The user stayed for more than 10 seconds They triggered a conversion event They viewed 2 or more pages or screens Formula: Engagement Rate = (Engaged Sessions / Total Sessions) x 100 So if 700 out of 1,000 sessions were engaged, your engagement rate is 70%. That is a clean, positive signal. It tells you more than ‘did they click elsewhere’ ever could. What Is Bounce Rate in GA4 Bounce rate in GA4 is literally the inverse. It measures the percentage of sessions that were NOT engaged. The user landed, stayed under 10 seconds, viewed only one page, and triggered no conversion. Formula: Bounce Rate = (Unengaged Sessions / Total Sessions) x 100 Here is the relationship that makes GA4 elegant: Engagement Rate + Bounce Rate = 100%. Always. If your engagement rate is 72%, your bounce rate is 28%. No ambiguity. This was not the case in Universal Analytics, where the definitions could overlap depending on how you set up events. GA4 keeps it simple. Engagement Rate vs Bounce Rate in GA4: Side-by-Side Here is how the two stack up across every dimension that matters: Feature Engagement Rate Bounce Rate What it measures Percentage of engaged sessions Percentage of unengaged sessions Formula Engaged Sessions / Total x 100 Unengaged Sessions / Total x 100 Session qualifies when 10s+ OR conversion OR 2+ pages Under 10s, no conversion, 1 page only Primary or secondary Primary metric Secondary metric In default GA4 reports Yes, available by default No, must be added manually Best for measuring Content quality and traffic value Quick-exit diagnosis and paid traffic Good benchmark 60% to 70%+ is healthy 25% to 40% is generally healthy UA equivalent Did not exist in UA Similar name, different definition in UA What Are Good Numbers for Each Metric There is no universal number that works across every industry. But these are solid starting benchmarks: Engagement Rate Benchmarks 60% to 70%: Good target for most sites Above 70%: Strong performance Below 50%: Needs attention, investigate by page and traffic source Bounce Rate Benchmarks 25% to 40%: Healthy for most site types 40% to 55%: Average, especially for blogs Above 65%: A warning sign worth investigating One important context point: blog pages and informational content naturally have higher bounce rates because people find what they need and leave. That is not always a problem. A 70% bounce rate on a recipe page is very different from a 70% bounce rate on a pricing page. If you want to understand what is really driving your numbers, a thorough SEO audit can surface exactly which pages are dragging your metrics down and why. How to Find Both Metrics in GA4 Engagement rate shows up by default in several GA4 reports. The quickest route is: Reports > Acquisition > Traffic Acquisition. Bounce rate is a bit more buried. Here is how to add it: Open the Traffic Acquisition report in GA4 Click the pencil icon (Customize report) in the top right corner Click Metrics in the right-hand panel Search for Bounce rate and click the + button to add it Click Apply. It stays in that report until you remove it You can also compare both metrics across different traffic sources in the same view, which makes it easy to spot if a specific channel is bringing low-quality visitors. Which Metric Should You Actually Focus On For most marketers and website owners, engagement rate is the better primary metric. It tells you something is working, not just that something failed to happen. Bounce rate earns its place when you are running paid traffic. If someone clicks an ad, lands on your page, and leaves in 4 seconds, you want to know that immediately. It could mean slow page speed, misleading ad copy, or a gap between what the user expected and what they found. A lot of bounce rate problems trace back to on-page SEO issues: poor page structure, content that does not match search intent, or headers that mislead visitors about what the page actually contains. For the technical side of things, your technical SEO setup plays a big role too. Slow load times, render-blocking scripts, and broken mobile experiences all push bounce rate up before the visitor has even read a word. What Causes a High Bounce Rate in GA4 These are the most common culprits, in rough order of frequency: Slow Page Speed If your page takes more than 3 seconds to load, a large portion of visitors will leave before seeing any content. This is a technical problem before it is a content problem. Content and Intent Mismatch Someone searches ‘GA4 bounce rate formula’ and lands on a page about analytics in general.
How to Reduce Bounce Rate A Complete UX Guide For Free

You open Google Analytics, scroll to the bounce rate column, and see a number that makes your stomach drop. Maybe it’s 72%. Maybe it’s 85%. Either way, it means the same thing: most people who land on your site leave without clicking a single other page. The frustrating part is that most advice on fixing bounce rate sounds like the same recycled checklist. Improve page speed. Write better content. Add internal links. But none of it tells you why your visitors are leaving or which fix will actually move the number for your specific site. This guide takes a different approach. We start by diagnosing the real causes, because a high bounce rate from paid traffic is a completely different problem than a high bounce rate from organic search. Then we walk through 10 UX-driven fixes that target those root causes directly. Whether you run a content blog, a lead-generation landing page, or an ecommerce store, you’ll leave with a practical action plan. One thing to keep in mind before we start: a high bounce rate is not always a crisis. Context matters more than the raw number. We’ll get to that shortly. A strong site structure also helps visitors discover related pages naturally. For websites struggling with engagement signals, improving overall search visibility often starts with a stronger technical SEO foundation. What Is Bounce Rate? Bounce rate is the percentage of sessions where a visitor lands on a page and leaves without any meaningful engagement. It measures how often your site fails to spark a second interaction. The precise definition depends on which version of Google Analytics you’re using, and that distinction matters more than most people realise. The Bounce Rate Formula The calculation is straightforward: Bounce Rate Formula Bounce Rate = (Number of single-page sessions ÷ Total sessions) x 100 Example: 400 unengaged sessions out of 1,000 total = 40% bounce rate. If your site had 5,000 sessions last month and 2,750 of those visitors left without engaging further, your bounce rate is 55%. Simple enough. The harder question is whether 55% is a problem, and the answer depends on factors we’ll cover in the next section. Bounce Rate in GA4 vs. Universal Analytics This is one of the most common points of confusion, and it trips up even experienced marketers. In the old Universal Analytics (UA), a bounce was counted any time a visitor viewed exactly one page before leaving. That included people who spent 10 minutes reading a detailed article then closed the tab. By that definition, a thoughtful reader who got exactly what they needed counted as a failure. GA4 changed this completely. In GA4, a session is only counted as a bounce if it meets all three of the following conditions: The session lasted under 10 seconds No conversion events were triggered The visitor viewed no additional pages or screens This means GA4’s bounce rate is an engagement-based metric. A visitor who reads your blog post for three minutes and then leaves is NOT a bounce in GA4, even if they only visited one page. That’s a much more accurate picture of whether your content is doing its job. Practical Implication If you recently migrated from Universal Analytics to GA4 and your bounce rate looks lower than it used to, that’s partly why. The measurement method changed, not just your site. Don’t compare the two numbers directly. Bounce Rate vs. Exit Rate: A Common Mix-Up These two metrics look similar in reports but measure different things. Mixing them up leads to the wrong diagnosis. Metric What It Measures When It Fires Bounce Rate Percentage of unengaged single-page sessions Visitor lands and leaves with no engagement Exit Rate Percentage of sessions that ended on a specific page Visitor leaves from that page, regardless of prior activity Here’s the difference in practice. A visitor lands on your homepage, clicks to a product page, reads it, then closes the browser. That session is not a bounce, because they engaged with multiple pages. But it does add to the exit rate of the product page, because that’s where the session ended. Exit rate helps you find where people leave your site. Bounce rate tells you whether people engage at all. Both matter, but for different reasons and different fixes. What Is a Good Bounce Rate? There’s no single answer that applies to every site. A 70% bounce rate might be perfectly healthy for a news blog and a serious warning sign for a SaaS landing page. The benchmark that matters is the one that matches your industry, page type, and traffic source. That said, industry data gives us a useful starting point. Bounce Rate Benchmarks by Industry Industry / Page Type Typical Bounce Rate Range What It Means Ecommerce (product pages) 30% to 45% Higher means shoppers aren’t exploring B2B / Lead generation 35% to 55% Visitors should be checking multiple pages SaaS / Software 40% to 55% Feature pages need to connect to each other Blogs and editorial content 65% to 80% Readers often find what they need and leave News and media sites 65% to 85% Normal due to single-article entry behaviour Landing pages (PPC) 60% to 90% Depends heavily on offer and traffic quality Contact / About pages 60% to 80% Single-purpose pages naturally bounce high Service / Agency sites 40% to 60% Visitors should explore service pages Source: These ranges reflect industry benchmarks from Siegemedia’s bounce rate research and aggregated GA4 data across multiple verticals. Whn a High Bounce Rate Is Actually Fine Not every high bounce rate signals a problem. There are legitimate situations where it’s the expected outcome: Single-page websites: If your site is a one-page portfolio or resume, almost everyone will bounce. There’s nowhere else to go. Wikipedia-style reference pages: Users land, get the answer, leave. That’s the whole point. Contact confirmation pages: After someone submits a form, they read the thank-you page and close the tab. A 90% bounce rate here is normal. Blog posts answering
Bounce Rate vs Pogo Sticking: What Google Actually Cares About
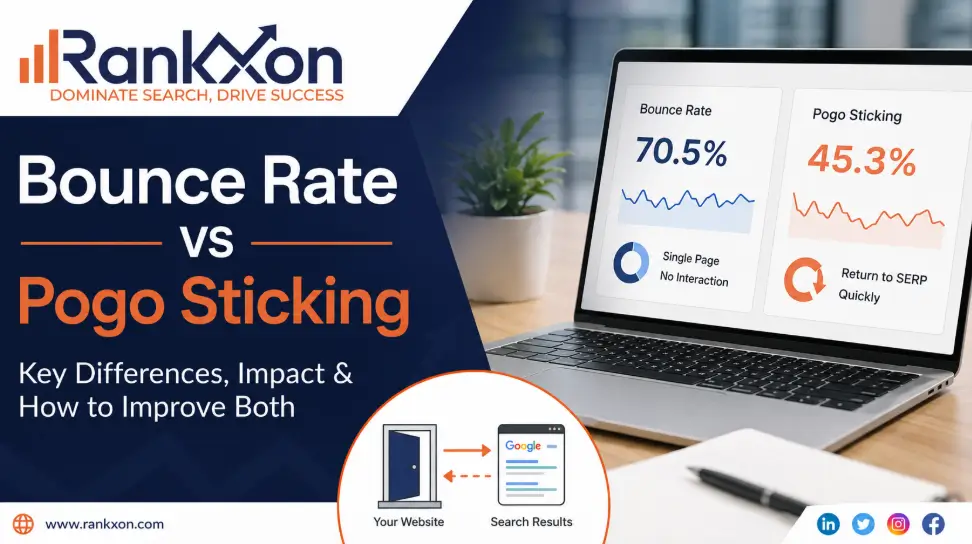
You check your rankings in the morning and suddenly a page that was performing well starts slipping. Traffic drops. Impressions stay stable, but clicks and engagement weaken. Most website owners immediately blame backlinks, content length, or another Google update. In many cases, the real issue is much simpler. Users are landing on the page, not finding what they expected, and returning to Google within seconds. That behavior matters more than most SEO metrics people obsess over. Understanding modern ranking signals requires more than just technical optimization. This is where the confusion between bounce rate and pogo sticking starts. Many marketers treat them as the same thing even though they measure completely different user actions. One can be completely normal. The other often signals that your page failed to satisfy search intent. Understanding the difference can help you improve rankings, reduce user drop-offs, and create pages that keep visitors engaged instead of pushing them back to search results. In this guide, you will learn: the real difference between bounce rate and pogo sticking how Google interprets user behavior why high bounce rates are not always bad what causes pogo sticking and how to improve engagement without chasing vanity metrics Bounce Rate vs Pogo Sticking: The Core Difference Although these terms are often grouped together, they describe different behaviors. Bounce rate measures whether a user visited only one page before leaving your website. Pogo sticking describes a user returning to Google search results quickly because the page did not satisfy their query. Here is the simplest way to understand it. Feature Bounce Rate Pogo Sticking User Action Leaves after viewing one page Returns to Google search results quickly Can It Be Good? Yes Usually no Related to Search Intent? Sometimes Directly SEO Impact Context dependent Signals dissatisfaction Time Factor Any duration Usually within seconds Common Cause Single-page session Poor relevance or user experience A visitor can spend five minutes reading your article, get their answer, and leave without clicking another page. That is still a bounce, but it is not a bad experience. Pogo sticking is different. If someone searches for “best running shoes for flat feet,” clicks your page, realizes it contains generic advice, and immediately returns to Google to click another result, that signals frustration. The difference comes down to satisfaction. What Is Bounce Rate in SEO? Bounce rate is the percentage of users who leave a website without taking another action such as clicking another page, filling out a form, or interacting with the site further. For years, marketers treated bounce rate like a direct SEO scorecard. That created a lot of bad advice. A high bounce rate does not automatically mean your content is poor. Imagine someone searching: weather in Los Angeles WhatsApp customer support number currency converter SEO checklist PDF If the page answers the query immediately, the user may leave after one page because they already got what they needed. That session still counts as a bounce. The important question is not: “Did they leave?” The important question is: “Did they leave satisfied?” How GA4 Changed Bounce Rate This is where many outdated SEO articles fail. Google Analytics 4 changed how bounce rate works. Instead of focusing only on page exits, GA4 measures engagement more intelligently. A session is considered engaged if users: stay longer than 10 seconds trigger a conversion event or view multiple pages That means modern SEO requires more context than simply watching bounce percentages. A 70% bounce rate on a blog post may be completely normal. A 30% bounce rate on a landing page with poor conversions may still indicate problems. Without context, bounce rate alone means very little. What Is Pogo Sticking? Pogo sticking happens when users click a search result, leave quickly, and return to Google to try another result. This behavior often happens because: the content did not match the search intent the page loaded too slowly the title was misleading the content looked untrustworthy the user experience created friction Unlike bounce rate, pogo sticking happens directly inside the search journey. That is why SEOs pay close attention to it. A Simple Example A user searches: “best CRM software for startups” They click your article. Instead of comparisons, pricing, and recommendations, they find a vague introduction stuffed with keywords. Within seconds, they hit the back button and choose another result. That is pogo sticking. The page attracted the click but failed to keep attention. Why Pogo Sticking Matters More Than Bounce Rate Google’s entire business depends on delivering useful search results. If users repeatedly return to search results after clicking a page, it suggests the result may not have solved the problem properly. Google has never officially confirmed pogo sticking as a direct ranking factor. However, user satisfaction signals clearly matter in modern search. Search engines analyze patterns such as: query reformulation repeat searches click behavior engagement depth long clicks versus short clicks This is why some pages lose rankings even with strong backlinks and technically optimized SEO. They satisfy algorithms but fail real users. Even websites with strong backlinks and authority signals can struggle if users consistently return to search results after clicking. Does Google Use Bounce Rate as a Ranking Factor? Google has repeatedly said that bounce rate itself is not a direct ranking factor. That statement is important because many SEO myths still treat bounce rate like a penalty signal. The confusion exists because people mix up bounce rate with user satisfaction. Google may not care about a simple bounce metric from Analytics, but it absolutely cares whether users find value in search results. That distinction changes how you should approach SEO. Instead of obsessing over reducing every bounce, focus on: matching intent improving readability answering queries quickly and keeping users engaged naturally That approach aligns much more closely with how modern search works. Many SEO myths still misunderstand how engagement metrics influence visibility, especially when discussing bounce rate signals and rankings. What Google Probably Measures Instead This is where the conversation becomes more useful.
